Show me a Change Pathways Map!
Below is a generic Change Pathways Map (CPM). Typically a CPM will comprise:
- Activities of the project (below in green) leading to…
- Outputs of the activities (below in blue) leading to…
- Consequences (further outputs or outcomes) of the outputs (below in blue) leading to…
- Consequences of the consequences (below in blue) leading to…
- Desired or intended impacts (below in purple)
- Connections (lines) between the above to indicate the ‘flow’.
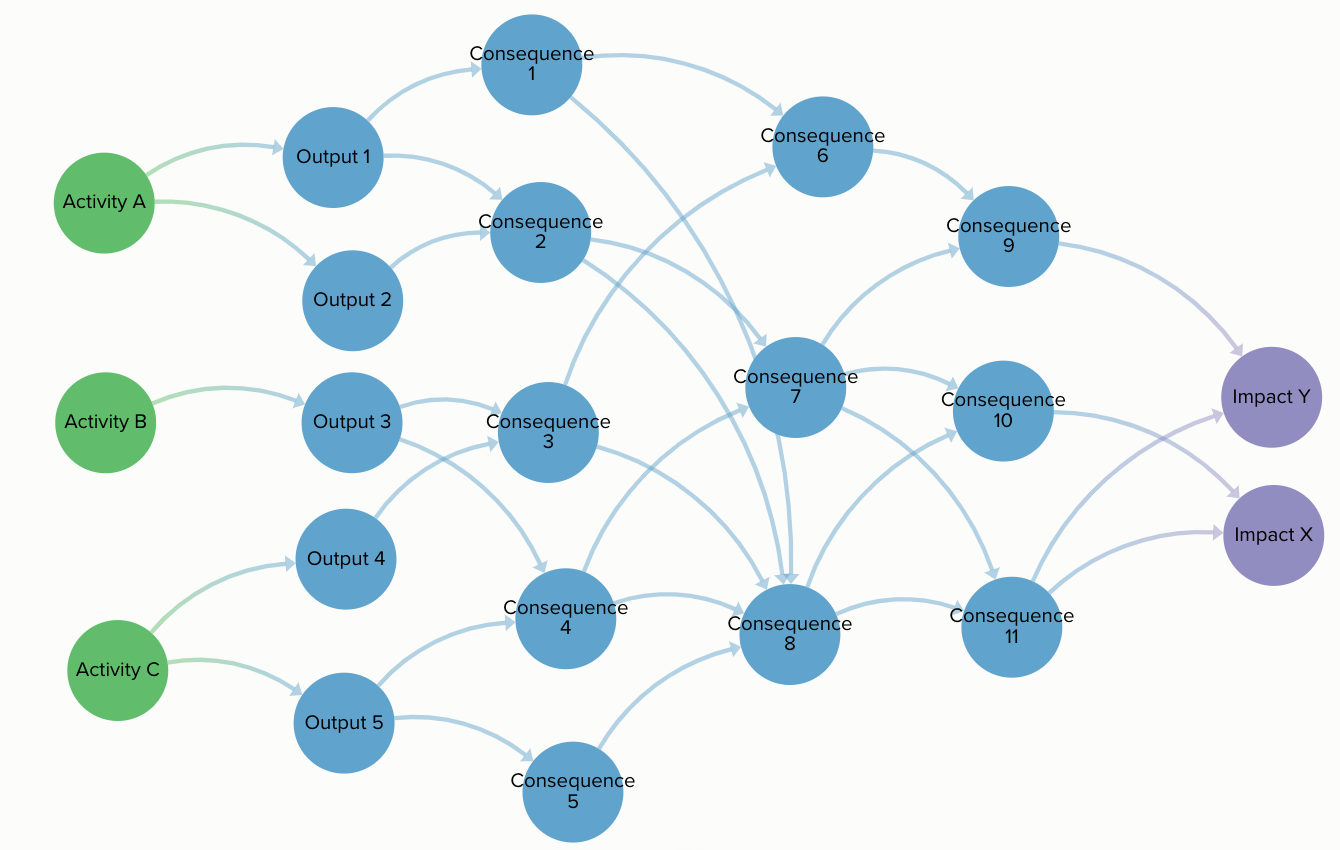
A Change Pathways Map is a collection of ‘elements’ (shapes with labels) and the connections (lines with arrowheads) between them. It is usually a sequential (time based) flow from left to right, perhaps with some feedback loops. It can actually be read from left to right (how the project activities lead to lasting change) or right to left (how lasting change might be brought about by the project’s activities).
Q: In the map above, what do you notice about the number of activities compared to the number of outputs? Or the number of immediate consequences of the outputs?
A: There is not always a one to one relationship between these. In fact, in permaculture projects, we usually design our projects so that each element supports many functions, and each important function is supported by multiple elements. You can expect to create a web!
During this course, you will learn to use a tool called Kumu to create and share your own map. For now we are going to look at an example of a CPM, using some screenshots.
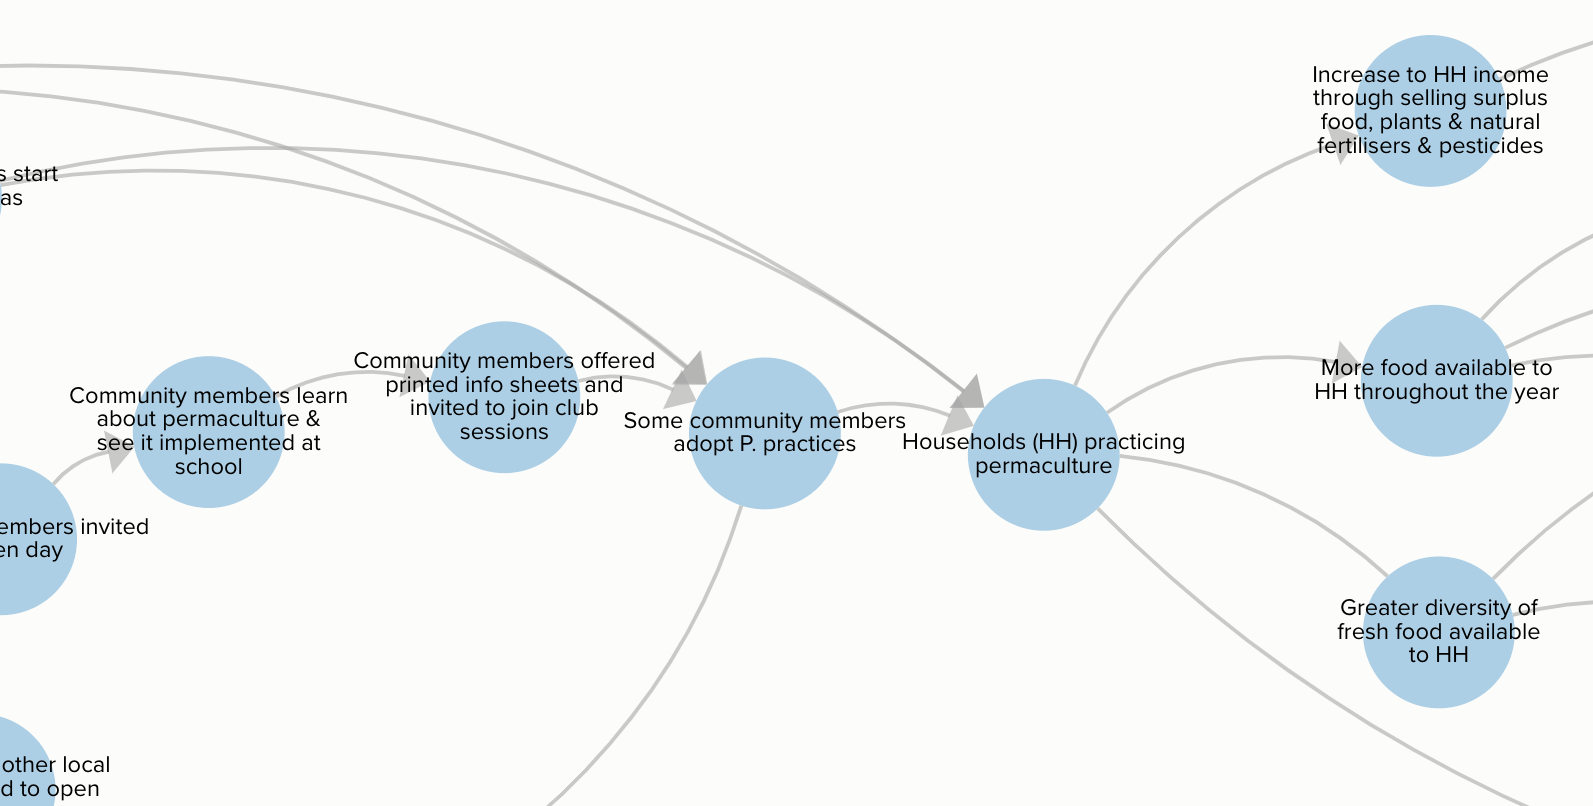
Below is a CPM for a project in Malawi which helps schools to establish their own permaculture clubs. The project’s activities are green, the schools’ activities are dark blue. Other outputs and outcomes are in pale blue and to the far right, the purple elements represent the overall impacts.
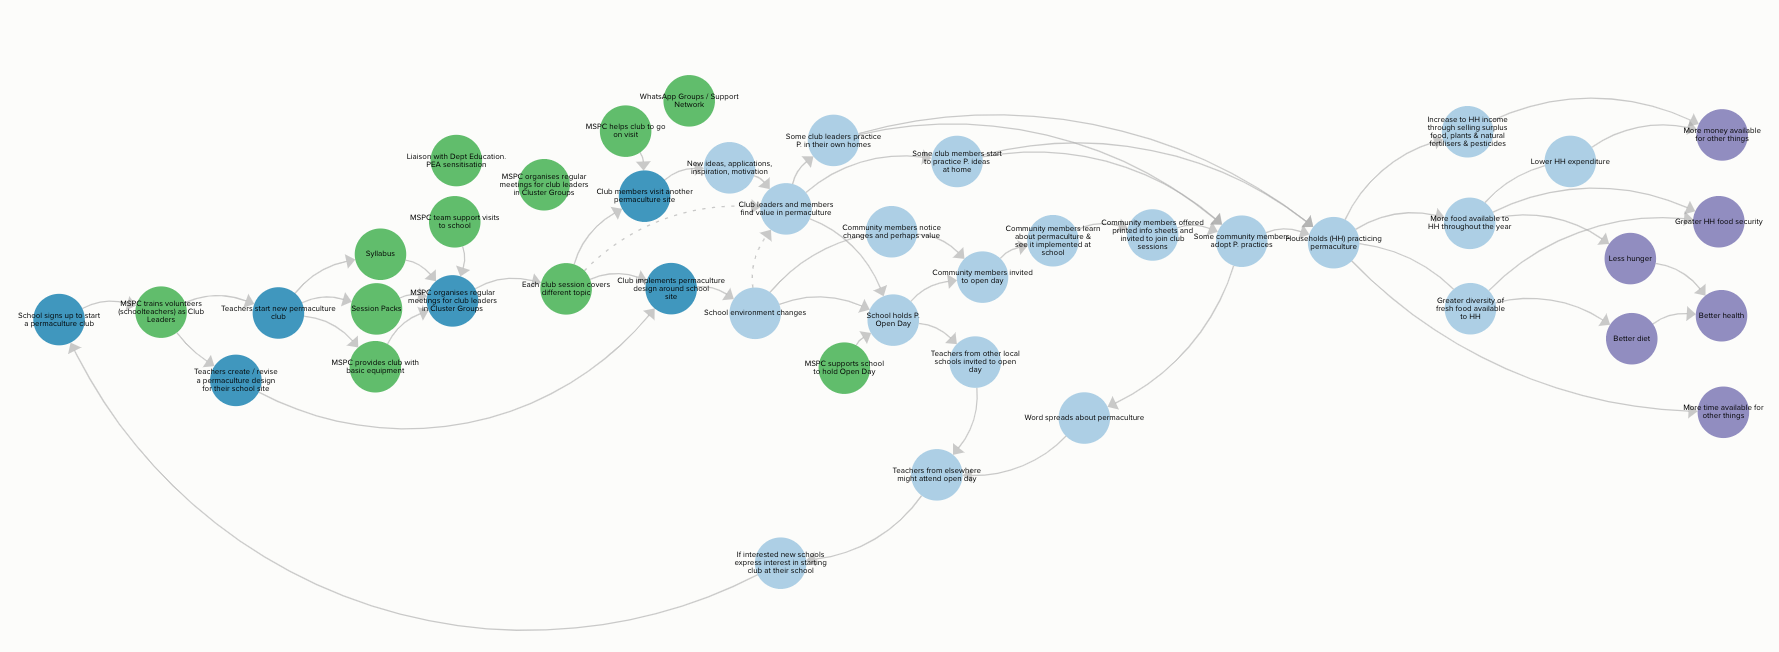
It’s very unlikely that you can see the detail in the image. Let’s have a look at some of this map in sections, working from left to right.
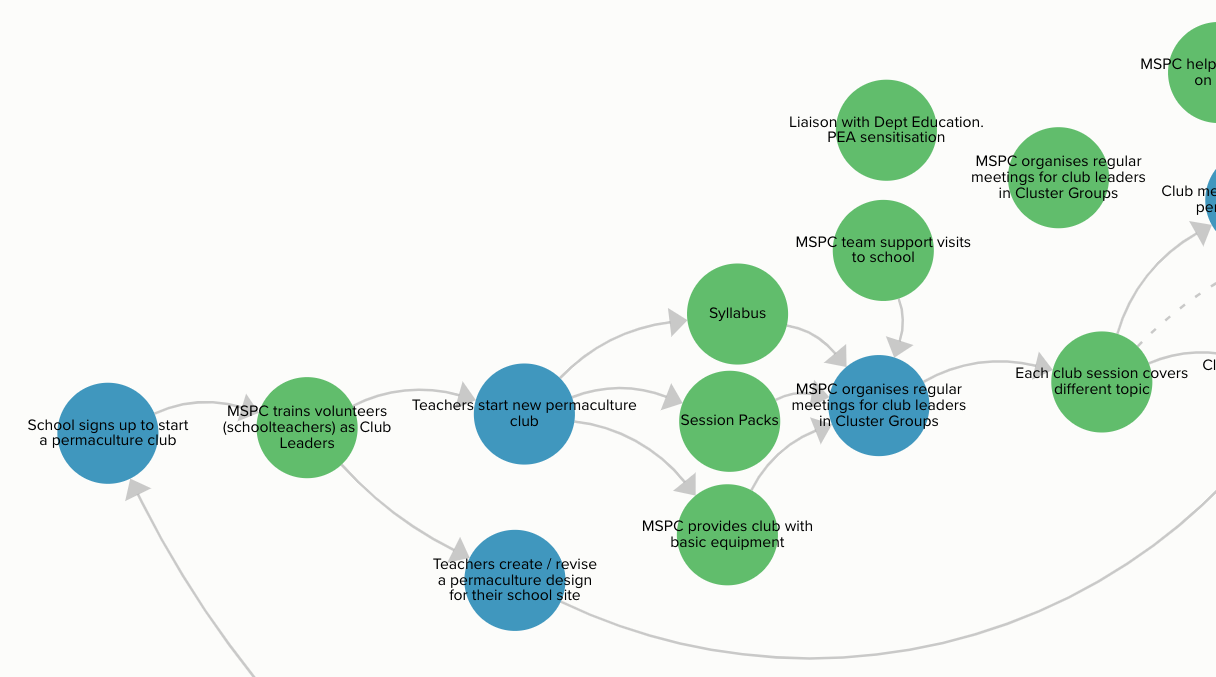
The section above shows that schools sign up with MSPC to start a permaculture club and MSPC trains teachers to be Club Leaders. The teachers then start a club at their school. MSPC provides various support upfront (syllabus, session packs, basic equipment), and helps teachers from different schools to meet up regularly in Cluster Groups.
These next two sections (below) are a continuation of the first section we looked at above. Here we start to see (in pale blue) how the clubs are affecting club members (school children), club leaders (teachers) and the wider community.
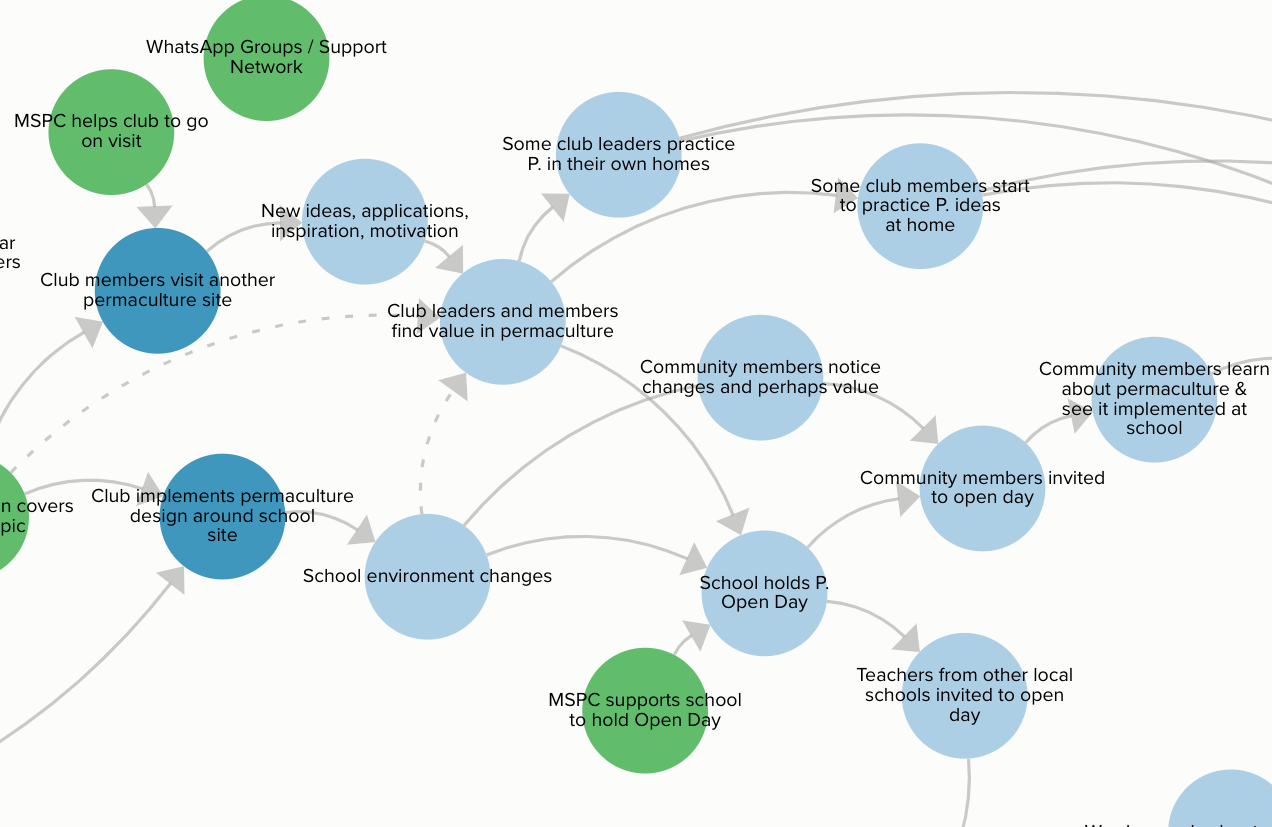
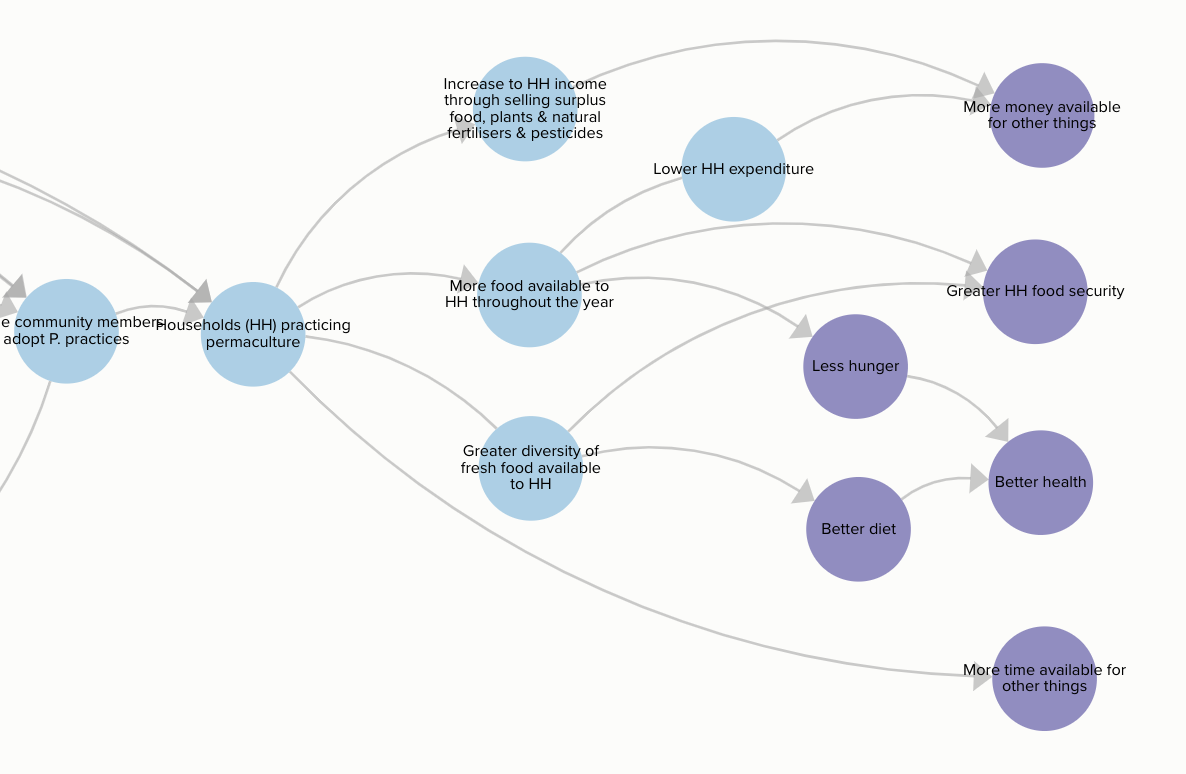
In this last section, we can see how the pale blue outcomes contribute to some long term impacts (purple).
Soon you will be able to explore this and other project’s maps in Kumu, which is much easier and more satisfying than squinting at screenshots!